We have covered a good amount of time in understanding the decision boundary. Check out the previous blog Logistic Regression for Machine Learning using Python. And how to overcome this problem of the sharp curve, with probability.
In the Logistic regression model the value of the classier lies between 0 to 1.

So to establish the hypothesis we also found the Sigmoid function or Logistic function.

So let’s fit the parameter θ for the logistic regression.
Likelihood Function
So let’s say we have datasets X with m data points. Now the logistic regression says, that the probability of the outcome can be modeled as below.
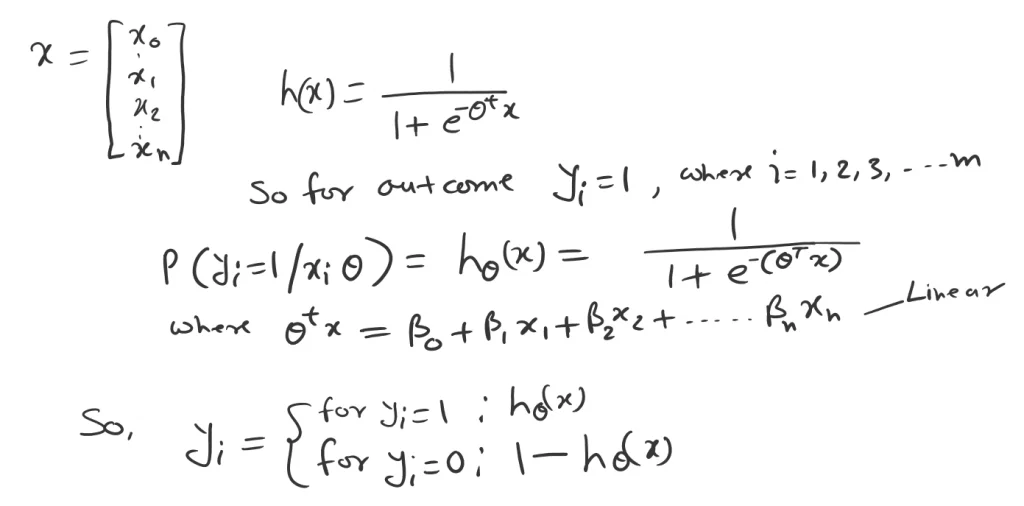
Based on the probability rule. If the success event probability is P then the fail event would be (1-P). That’s how the Yi indicates above.
This can be combined into a single form as below.

This means, what is the probability of Xi occurring for a given Yi value P(x|y)?
The likelihood of the entire dataset X is the product of an individual data point. This means a forgiven event (coin toss) H or T. If H probability is P then T probability is (1-P).
So, the Likelihood of these two events is.
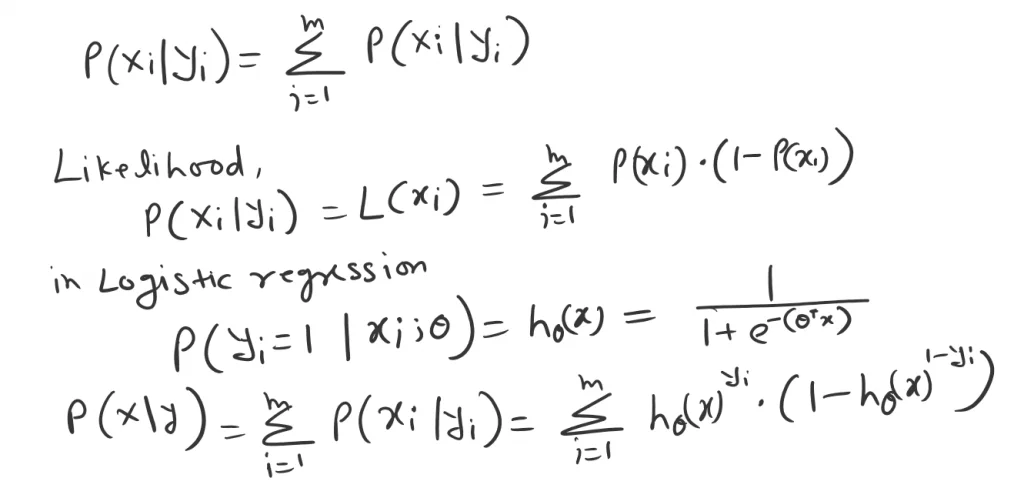
Now the principle of maximum likelihood says. we need to find the probability that maximizes the likelihood P(X|Y). Recall the odds and log-odds.

So as we can see now. After taking a log we can end up with the linear equation.

So in order to get the parameter θ of the hypothesis. We can either maximize the likelihood or minimize the cost function.
Now we can take a log from the above logistic regression likelihood equation. Which will normalize the equation into log odds.

MLE is the Maximum likelihood estimation.
What is Cost Function?
In Machine learning, the cost function is a mathematical function that measures the performance of the model. In another word, we can say the difference between the predicted output and the actual output of the model.
I would recommend first checking this blog on The Intuition Behind Cost Function.
In logistic regression, we create a decision boundary. And this will give us a better seance of, what logistic regression function is computing.
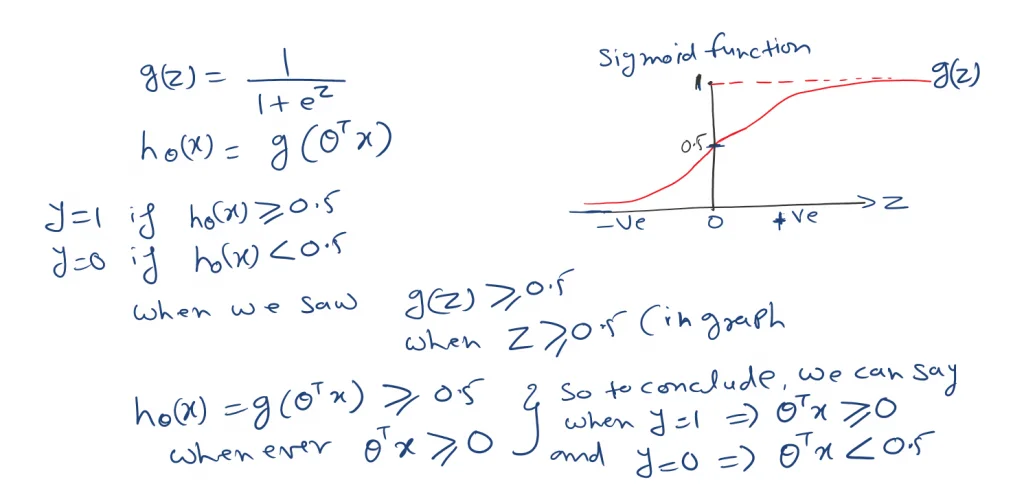
As we know the cost function for linear regression is residual sum of squares.
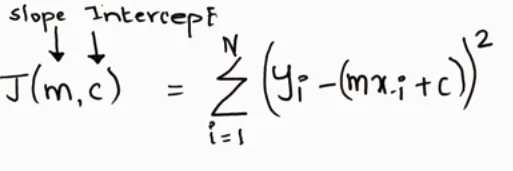
We can also write as below. Taking half of the observation.
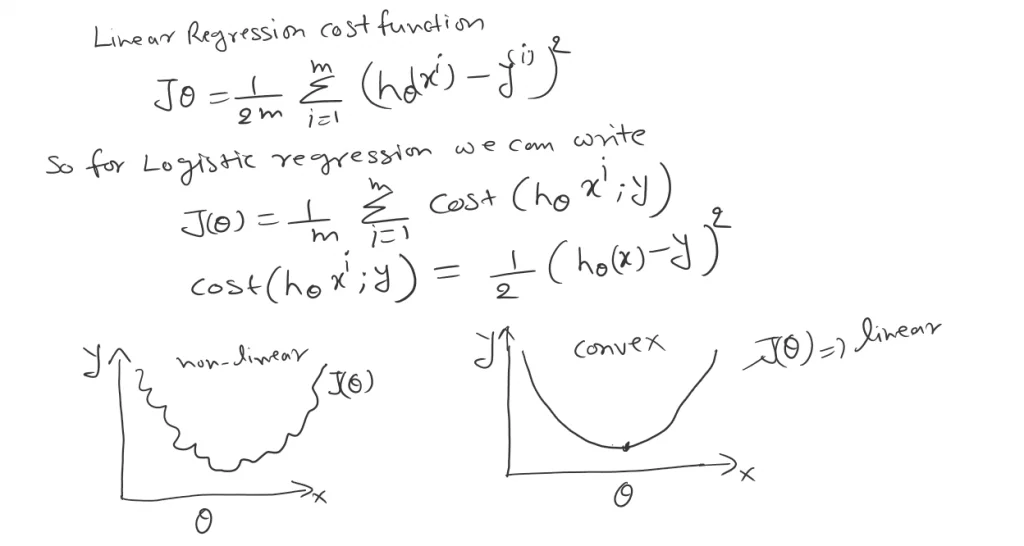
As we can see in logistic regression the H(x) is nonlinear (Sigmoid function). And for linear regression, the cost function is convex in nature. For linear regression, it has only one global minimum. In nonlinear, there is a possibility of multiple local minima rather the one global minima.
So to overcome this problem of local minima. And to obtain global minima, we can define a new cost function. We will take the same reference as we saw in Likelihood.

Cross entropy loss or log loss or logistic regression cost function. cross-entropy loss measures the performance of the classification model. And the output is a probability value between 0 to 1
So the cost function is as bellow.

Now we can put this expression into the Cost function Fig-8.
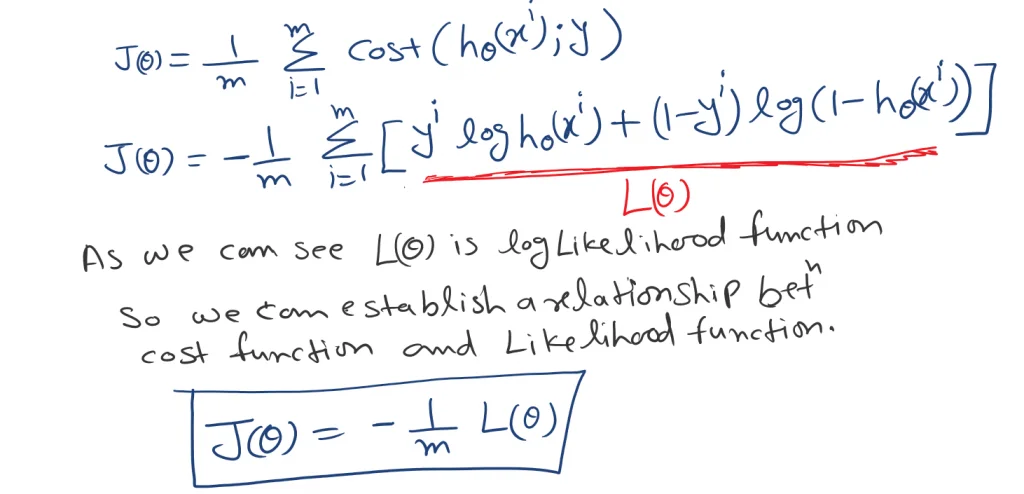
As we can see L(θ) is a log-likelihood function in Fig-9. So we can establish a relationship between the Cost function and the Log-Likelihood function. You can check out Maximum likelihood estimation in detail.
Maximization of L(θ) is equivalent to min of -L(θ) and using average cost over all data points, our cost function would be.


Choosing this cost function is a great idea for logistic regression. Because Maximum likelihood estimation is an idea in statistics to find efficient parameter data for different models. And has also properties that are convex in nature.
Gradient Descent
Now we can reduce this cost function using gradient descent. The main goal of Gradient descent is to minimize the cost value. i.e. min J(θ).

Now to minimize our cost function we need to run the gradient descent function on each parameter i.e.
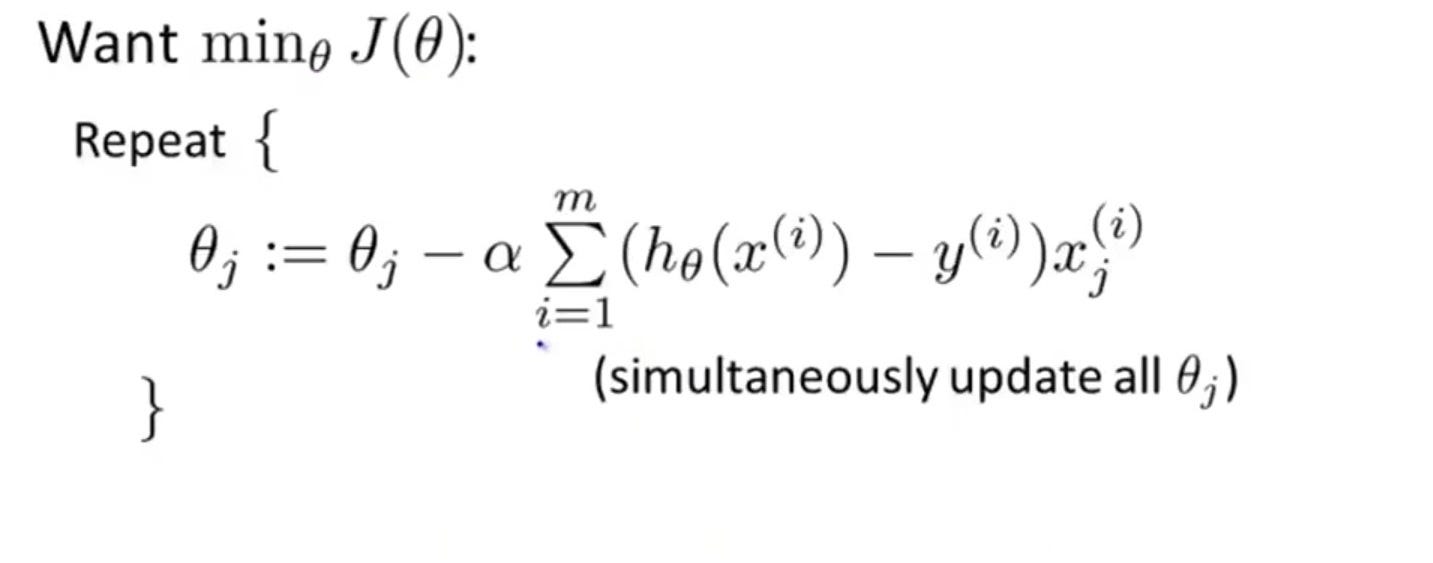
Gradient descent is an optimization algorithm used to find the values of the parameters. To solve for the gradient, we iterate through our data points using our new m and b values and compute the partial derivatives.
Additional reading on Gradient descent
Gradient Descent for Logistic Regression Simplified – Step-by-Step Visual Guide
Footnotes:
Additional Reading
- AI vs ML vs DL vs Data Science
- Logistic Regression for Machine Learning
- What is Cost Function in Linear regression?
- Maximum Likelihood Estimation (MLE) for Machine Learning
OK, that’s it, we are done now. If you have any questions or suggestions, please feel free to comment. I’ll come up with more Machine Learning and Data Engineering topics soon. Please also comment and subs if you like my work any suggestions are welcome and appreciated.
You can subscribe to my YouTube channel

Good read…
Thanks Narendra
Thanks for sharing. I read many of your blog posts, cool, your blog is very good.